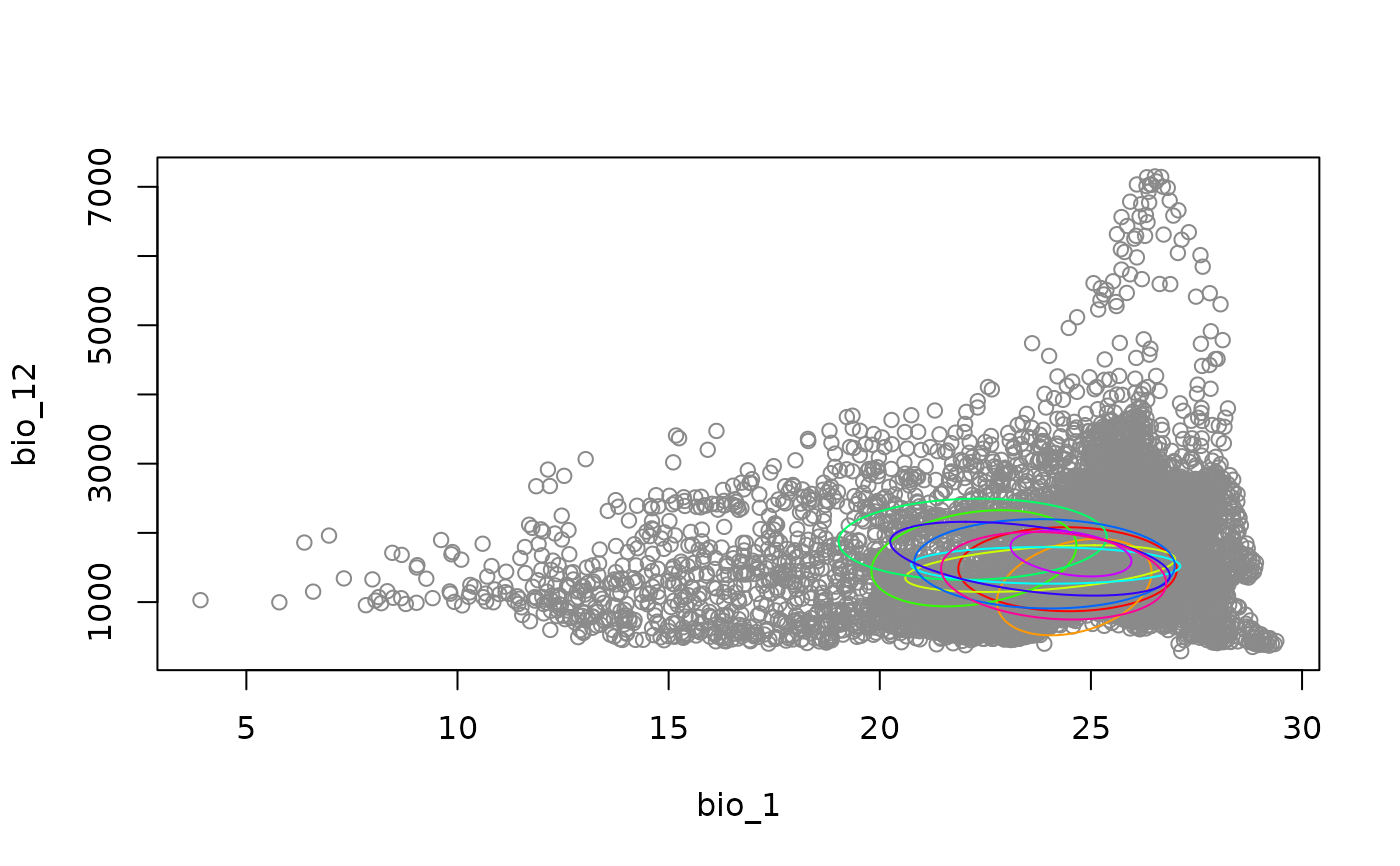
Visualizes a nicheR_community object by plotting the background
environmental space and the community of ellipses.
Usage
plot_community(object, background = NULL, dim = c(1, 2), bg_sample = NULL,
               lty = 1, lwd = 1, col_comm = NULL, col_bg = "#8A8A8A",
               pch = 1, alpha_bg = 1, alpha_comm = 1, cex_bg = 1,
               cex_comm = 1, ...)
Arguments
- object
A
nicheR_communityobject generated by one of the community simulation functions (e.g.,random_ellipses,nested_ellipses,conserved_ellipses).- background
Matrix or Dataframe. The environmental background points.
- dim
Numeric vector of length 2. The indices of the variables to plot (default is
c(1, 2)).- bg_sample
Integer. Number of background points to sample for plotting. The default, NULL, plots all background points.
- lty, lwd
Numeric. Line type and width for community ellipses.
- col_comm
Character vector. Colors for the community ellipses. Defaults to a rainbow palette.
- col_bg
Character. Color for the background points.
- pch
Integer or point character for background points.
- alpha_bg, alpha_comm
Numeric. Transparency for background and ellipses.
- cex_bg, cex_comm
Numeric. Character expansion for points/lines.
- ...
Additional arguments passed to the base
plotfunction (e.g.,xlim,ylim,xlab,ylab).
Examples
# Loading data
## Reference niche
data("ref_ellipse", package = "nicheR")

## Background data
data("back_data", package = "nicheR")

# Generate community of conserved ellipses
conserved_comm <- conserved_ellipses(object = ref_ellipse,
                                    background = back_data[, c(3, 7)],
                                    n = 10)

# Plot the community
plot_community(conserved_comm, background = back_data[, c(3, 7)])