Add occurrence points or other data to an existing E-space plot
Source:R/plot_utilities.R
add_data.RdAdds points to an existing environmental space plot created with
plot_ellipsoid(). Points can be plotted with a single color or
colored by a continuous variable (e.g., suitability) using a color palette.
Usage
add_data(data, x, y,
                pts_col = "#000000",pts_alpha  = 1,
                col_layer = NULL,
                pal = hcl.colors(100, palette = "Viridis"), rev_pal = FALSE,
                pch = 1, cex = 1, bg_sample = NULL, ...)
Arguments
- data
A data frame containing the points to plot. Must include columns matching
xandy, andcol_layerif provided.- x
Character. Name of the column to use as the x-axis variable.
- y
Character. Name of the column to use as the y-axis variable.
- pts_col
Character. Color for all points when
col_layerisNULL. Default is"#000000"(black).- pts_alpha
Numeric in
[0, 1]. Transparency of points whencol_layerisNULL. Default is1(fully opaque).- col_layer
Character or
NULL. Name of a column indatato use for coloring points by a continuous variable. IfNULL(default), all points are drawn withpts_col.- pal
A color palette function or character vector of colors used when
col_layeris provided. Default ishcl.colors(100, palette = "Viridis").- rev_pal
Logical. If
TRUE, reverses the color palette before applying it. Default isFALSE.- pch
Integer or character. Point symbol. Default is
1.- cex
Numeric. Size scaling for points. Default is
1.- bg_sample
Integer or
NULL. If provided andnrow(data)exceeds this value, a random subsample of this size is drawn before plotting. Useful for large data frames. Default isNULL(plot all).- ...
Additional arguments passed to
points.
Details
When col_layer is provided, points are colored by the values of that
column mapped onto the palette. NAs in col_layer are removed
before plotting; zeros are retained as valid values (e.g., truncated
suitability predictions outside the ellipsoid boundary).
Examples
data("ref_ellipse", package = "nicheR")
data("back_data", package = "nicheR")
# Open base plot then add centroid as a cross
plot_ellipsoid(ref_ellipse,
background = back_data,
col_ell = "#e10000", col_bg = "grey80",
lwd = 2, pch = 20, cex_bg = 0.4,
xlab = "Bio1", ylab = "Bio12")
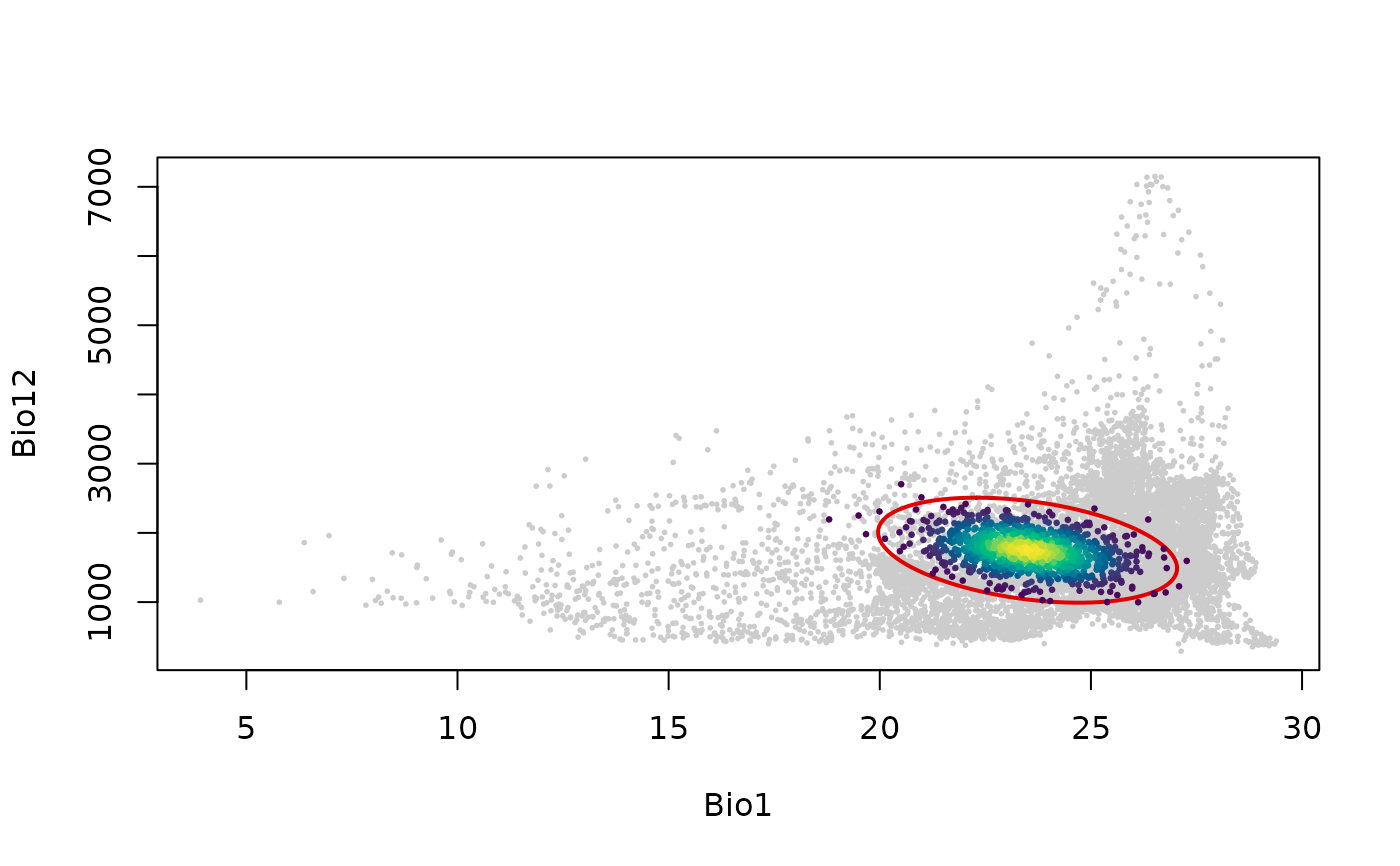
# Add points colored by suitability on top of background
pred_df <- utils::read.csv(system.file("extdata", "predictions_virt.csv", package = "nicheR"))
plot_ellipsoid(ref_ellipse,
background = back_data,
col_ell = "#e10000", col_bg = "grey80",
lwd = 2, pch = 20, cex_bg = 0.4,
xlab = "Bio1", ylab = "Bio12")
add_data(pred_df,
x = "bio_1", y = "bio_12",
col_layer = "suitability",
pch = 20, cex = 0.5)