Draws the 2D boundary of a nicheR_ellipsoid object onto an existing
environmental space plot created with plot_ellipsoid(). The boundary
is computed as a cross-section of the ellipsoid at the chosen pair of
dimensions.
Usage
add_ellipsoid(object,
                     dim = c(1, 2), lty = 1, lwd = 1,
                     col_ell = "#000000", alpha_ell = 1,
                     cex_ell = 1, ...)
Arguments
- object
A
nicheR_ellipsoidobject.- dim
Integer vector of length 2. Indices of the two dimensions to plot. Default is
c(1, 2).- lty
Integer. Line type. Default is
1(solid).- lwd
Numeric. Line width. Default is
1.- col_ell
Character. Color of the ellipsoid boundary line. Default is
"#000000"(black).- alpha_ell
Numeric in
[0, 1]. Transparency of the ellipsoid boundary line. Default is1(fully opaque).- cex_ell
Numeric. Size scaling for the ellipsoid boundary. Default is
1.- ...
Additional arguments passed to
lines.
Examples
data("example_sp_2", package = "nicheR")
data("example_sp_1", package = "nicheR")
data("back_data", package = "nicheR")
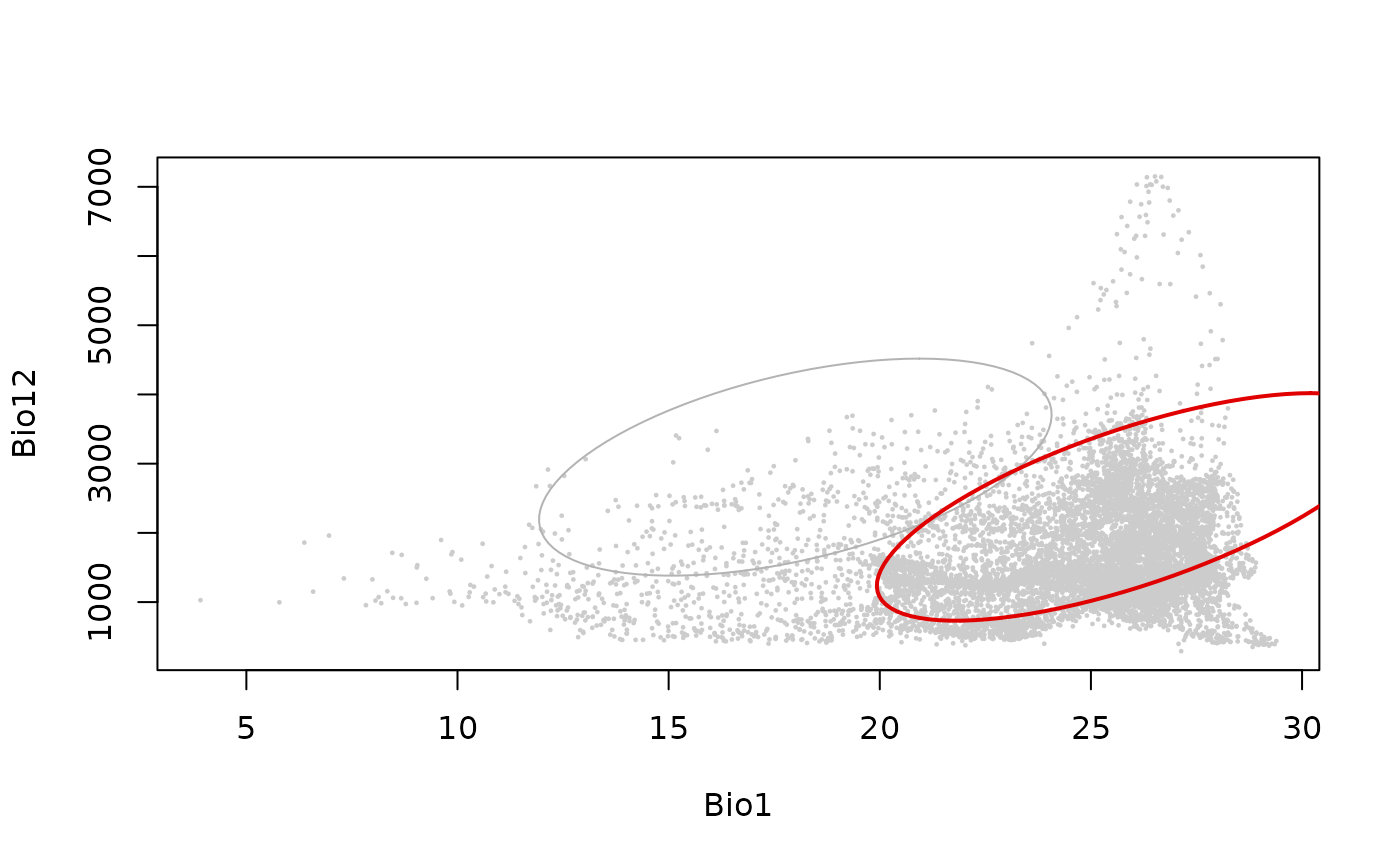
# Open a plot, then overlay the ellipsoid prominently
plot_ellipsoid(example_sp_2,
background = back_data,
col_ell = "grey70", col_bg = "grey80",
lwd = 1, pch = 20, cex_bg = 0.3,
xlab = "Bio1", ylab = "Bio12")
add_ellipsoid(example_sp_1, col_ell = "#e10000", lwd = 2)
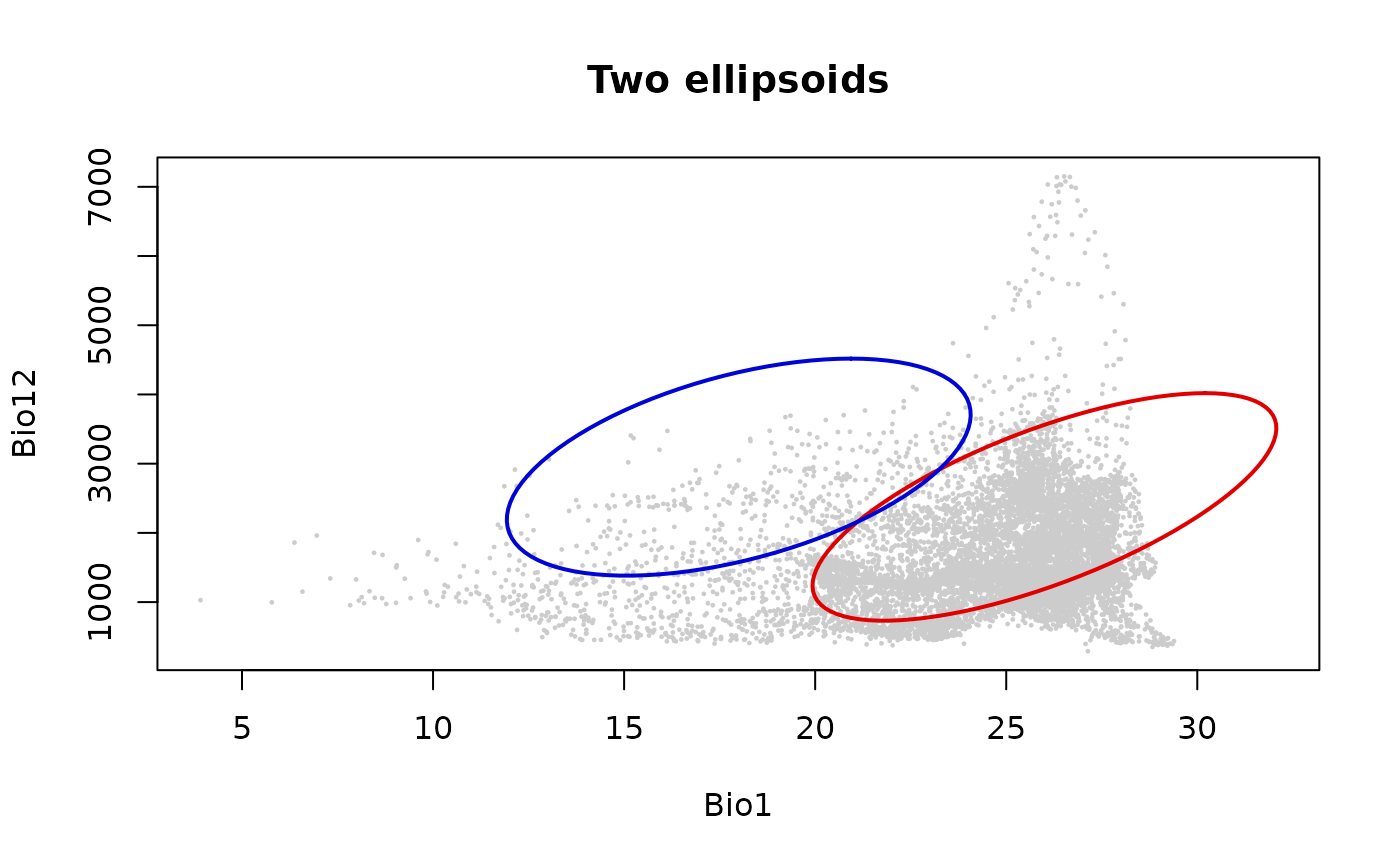
 # Compare two ellipsoids on the same plot
plot_ellipsoid(example_sp_1,
background = back_data,
col_ell = "#e10000", col_bg = "grey80",
lwd = 2, pch = 20, cex_bg = 0.3,
xlab = "Bio1", ylab = "Bio12",
main = "Two ellipsoids")
add_ellipsoid(example_sp_2, col_ell = "#0004d5", lwd = 2)
# Compare two ellipsoids on the same plot
plot_ellipsoid(example_sp_1,
background = back_data,
col_ell = "#e10000", col_bg = "grey80",
lwd = 2, pch = 20, cex_bg = 0.3,
xlab = "Bio1", ylab = "Bio12",
main = "Two ellipsoids")
add_ellipsoid(example_sp_2, col_ell = "#0004d5", lwd = 2)